UI Features
A comprehensive reference for every feature of the Intelligence Engine web UI.
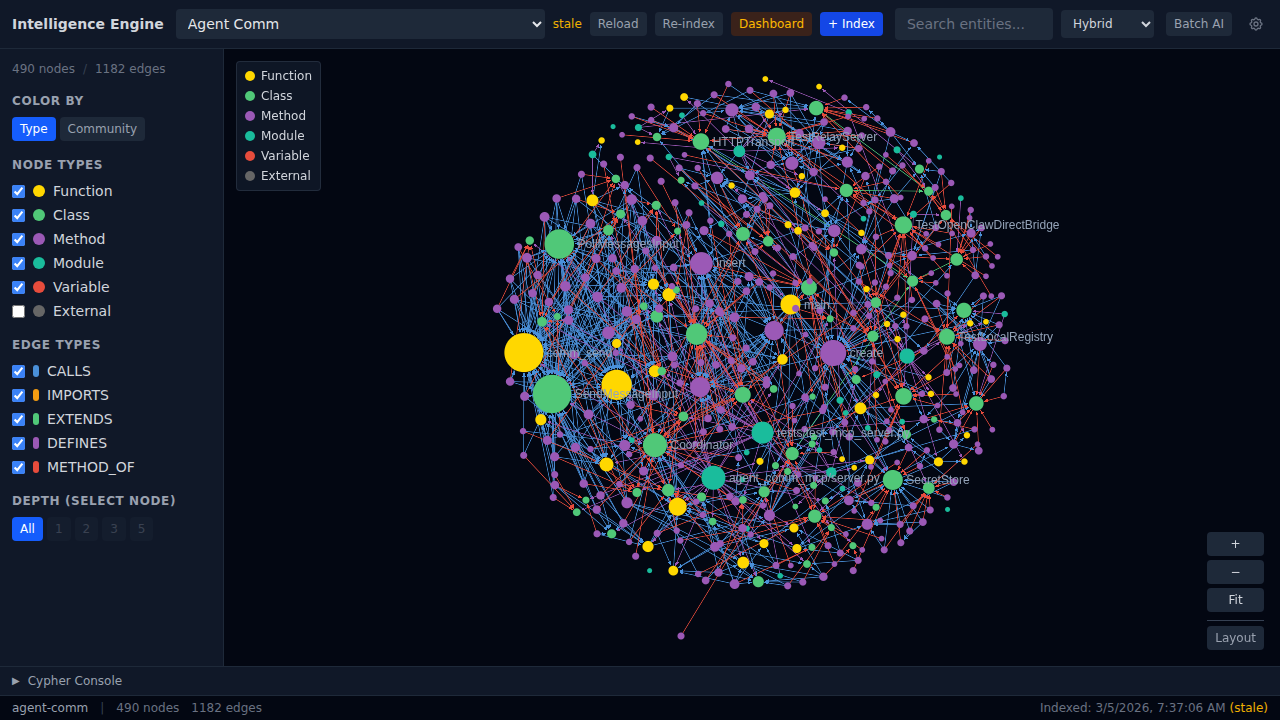
Graph Visualization
The centerpiece of the UI is an interactive force-directed graph that renders your codebase as a network of entities and relationships.
Layout
The graph uses a force-directed layout algorithm that simulates physical forces to position nodes organically. Connected nodes attract each other while unconnected nodes repel, producing a layout that naturally clusters related code together.
- Node sizing is determined by connectivity — entities with more relationships appear as larger nodes, making hubs and central abstractions immediately visible.
- Edge coloring encodes relationship type at a glance:
| Relationship | Color |
|---|---|
| CALLS | Blue |
| IMPORTS | Red |
| EXTENDS | Green |
| DEFINES | Pink |
| METHOD_OF | Red |
Zoom and Pan Controls
The graph viewport supports mouse-wheel zoom and click-drag panning. A set of control buttons is provided for precise navigation:
| Button | Action |
|---|---|
| + | Zoom in |
| - | Zoom out |
| Fit | Fit the entire graph into the viewport, adjusting zoom and position automatically |
| Focus | Center the view on the currently selected node |
| Layout | Re-run the force-directed layout algorithm to reposition all nodes from scratch |
Color Modes
The graph supports two distinct coloring modes that can be toggled to reveal different aspects of the codebase.
Type Mode
Each node is colored according to its entity type:
| Entity Type | Color |
|---|---|
| Function | Yellow |
| Class | Green |
| Method | Purple |
| Module | Teal |
| Variable | Red |
| External | Gray |
Type mode is the default and is useful for understanding the composition of your codebase — quickly seeing the ratio of classes to functions, spotting modules, and identifying external dependencies.
Community Mode
In Community mode, nodes are colored by auto-detected clusters. The Intelligence Engine uses a community detection algorithm to identify groups of tightly coupled entities. Each community is assigned a distinct color.
A modularity score is displayed alongside the community visualization. This score (ranging from 0 to 1) indicates how well-separated the communities are — higher scores suggest a more modular, well-structured codebase with clear boundaries between components.
Node Type Filters
A filter panel provides checkbox toggles to show or hide entities by type. Each entity type (Function, Class, Method, Module, Variable) has its own checkbox. An additional External toggle controls visibility of external dependency nodes.
Edge Type Filters
Alongside node type filters, edge type filters allow you to isolate specific kinds of relationships:
- CALLS — Function/method call relationships
- IMPORTS — Module import relationships
- EXTENDS — Class inheritance relationships
- DEFINES — Definition relationships (e.g., a module defining a function)
- METHOD_OF — Method-to-class ownership relationships
Combining node and edge filters lets you focus on exactly the slice of the codebase you care about — for example, showing only classes and their EXTENDS edges to visualize an inheritance hierarchy.
Depth Filter
The depth filter controls how many hops from a selected node are displayed. Available depth levels:
| Level | Description |
|---|---|
| All | Show the entire graph (no depth restriction) |
| 1 | Direct neighbors only |
| 2 | Neighbors and their neighbors |
| 3 | Three hops from the selected node |
| 5 | Five hops from the selected node |
The depth filter requires a selected node to function — it defines the center of the ego-network subgraph. When a node is selected and a depth level is chosen, the graph is filtered to show only the subgraph reachable within that many hops, providing a focused view of a specific entity’s local neighborhood.
Entity Detail Panel
Clicking a node in the graph opens the Entity Detail Panel, which provides comprehensive information about the selected entity.
File Location
Displays the file path and line range where the entity is defined (e.g., src/server.ts:45-120).
Docstring
If the entity has a docstring or JSDoc comment, it is displayed in full.
AI Summary
A generated natural-language summary of the entity. Click the Generate button to produce an AI summary on demand. The summary describes what the entity does, its purpose, and its role in the codebase.
Ask AI
A set of pre-built AI question buttons for instant analysis:
| Button | What it does |
|---|---|
| Explain this | Provides a detailed explanation of the entity’s behavior and purpose |
| Find bugs | Analyzes the entity for potential bugs, edge cases, and error-handling gaps |
| Suggest improvements | Recommends refactoring opportunities, performance improvements, and best practices |
| Document this | Generates documentation (docstring/JSDoc) for the entity |
| How is this used? | Traces callers and usage patterns across the codebase |
| Security concerns? | Identifies potential security vulnerabilities and attack surfaces |
A custom question input field is also available, allowing you to type any free-form question about the selected entity and get an AI-generated answer.
View All in AI Memory
A link labeled “View all in AI Memory” opens the AI Memory browser filtered to the selected entity, showing all stored summaries, Q&A pairs, and analysis results.
Callers List
A CALLERS section lists every entity that calls or references the selected entity, along with a count of total callers. Each caller is clickable to navigate to that entity.
Q&A History
Previously asked questions and their AI-generated answers are preserved and displayed in a Q&A History section, providing a persistent record of analysis for each entity.
Source Code (Expandable)
An expandable section at the bottom of the panel reveals the full source code of the selected entity with syntax highlighting and line numbers.
Source Code Viewer
The source code viewer provides a syntax-highlighted display of the file containing the selected entity. Line numbers are shown in a gutter alongside the code for easy reference. The viewer automatically scrolls to and highlights the relevant line range of the selected entity within its file.
Search Bar
The search bar at the top of the UI supports hybrid search with a strategy selection dropdown. Three search strategies are available:
| Strategy | Description |
|---|---|
| Hybrid | Combines BM25 keyword matching with semantic vector similarity for the best of both approaches |
| BM25 | Classic term-frequency keyword search, best for exact name lookups |
| Semantic | Embedding-based similarity search, best for conceptual queries like “error handling” or “database connection” |
Search Results
Results are displayed as a list, each entry showing:
- Entity type icon — Visual indicator of the entity type (function, class, etc.)
- Name — The entity name, clickable to select it in the graph
- Search strategy tag — Badge indicating which strategy matched this result
- Relevance score — Numerical score indicating match quality
Dashboard
The Dashboard provides project-level analytics and is organized into 6 tabs:
Timeline
Displays the indexing history of the project as a chronological timeline. Shows when each index was created, how long it took, and the number of entities and relationships discovered.
Phases
A stacked bar chart showing the breakdown of indexing phases (parsing, extraction, relationship resolution, embedding generation, etc.) and how much time each phase consumed. Useful for diagnosing indexing performance.
Health
Codebase health indicators including:
- Dead code — Entities that are defined but never called or referenced
- Cycles — Circular dependency chains detected in the codebase
- Hubs — Entities with unusually high connectivity that may represent coupling hotspots
Compare
A cross-project comparison table showing metrics side by side for multiple projects. Enables benchmarking of codebase size, complexity, health scores, and documentation coverage across your indexed projects.
Quality
Displays a composite quality score along with its component metrics:
- Complexity — Code complexity analysis
- Documentation coverage — Percentage of entities with docstrings or documentation
AI Mem
A unified memory browser that displays all AI-generated content (summaries, Q&A pairs, analysis results) stored for the current project. Provides a searchable, browsable interface to all accumulated AI knowledge about the codebase.
Cypher Console
An expandable panel at the bottom of the UI that provides direct access to the graph database via the Cypher query language.
Templates
A Templates dropdown contains 33 pre-built queries covering common analysis patterns such as:
- Finding the most connected entities
- Listing dead code
- Detecting circular dependencies
- Identifying inheritance hierarchies
- Tracing call chains
- And many more
Execution
Click the Run button to execute a query (either selected from templates or written manually). Results are displayed in a tabular format showing:
- Column headers matching the query’s return values
- Data rows for each result
- Row count — Total number of results returned
- Execution time — How long the query took to run
Toolbar
The main toolbar spans the top of the UI and provides global controls:
| Control | Description |
|---|---|
| Project selector | Dropdown listing all 54 indexed projects. Selecting a project loads its graph and data. |
| Stale indicator | Visual badge that appears when the current index is outdated relative to the source code |
| Reload | Reloads the current project’s graph data from the database without re-indexing |
| Re-index | Triggers a full re-index of the current project, rebuilding the graph from source |
| Dashboard | Opens the Dashboard panel |
| +Index | Opens a dialog to index a new project by specifying its path |
| Search bar | The hybrid search input (see Search Bar section above) |
| Search mode | Dropdown to select the search strategy (Hybrid, BM25, Semantic) |
| Batch AI | Triggers batch AI analysis across multiple entities in the current project |
| Settings gear | Opens the Settings Modal |
Settings Modal
The Settings Modal provides configuration for LLM providers used by the AI features (summaries, Q&A, analysis).
LLM Provider Configuration
Three providers are supported, each with its own configuration fields:
| Provider | Fields |
|---|---|
| Claude | API Key, Model (e.g., claude-sonnet-4-20250514) |
| OpenAI | API Key, Model (e.g., gpt-4o) |
| Gemini | API Key, Model (e.g., gemini-3-pro-preview) |
Enter your API key and preferred model for whichever provider(s) you wish to use. The selected provider will be used for all AI-powered features including summary generation, Ask AI queries, and batch analysis.
Status Bar
The status bar runs along the bottom of the UI and displays at-a-glance information about the current project:
| Element | Description |
|---|---|
| Project name | The name of the currently loaded project |
| Node count | Total number of entities (nodes) in the graph |
| Edge count | Total number of relationships (edges) in the graph |
| Index timestamp | When the current index was last built |
| Stale indicator | Appears when source files have been modified since the last index, indicating a re-index may be needed |